Gantt Chart

What is a Gantt chart?
A Gantt chart is a visual planning tool that is often used in project management. The Gantt chart was developed around 1900 by Henry L. Gantt, an American engineer and management consultant.
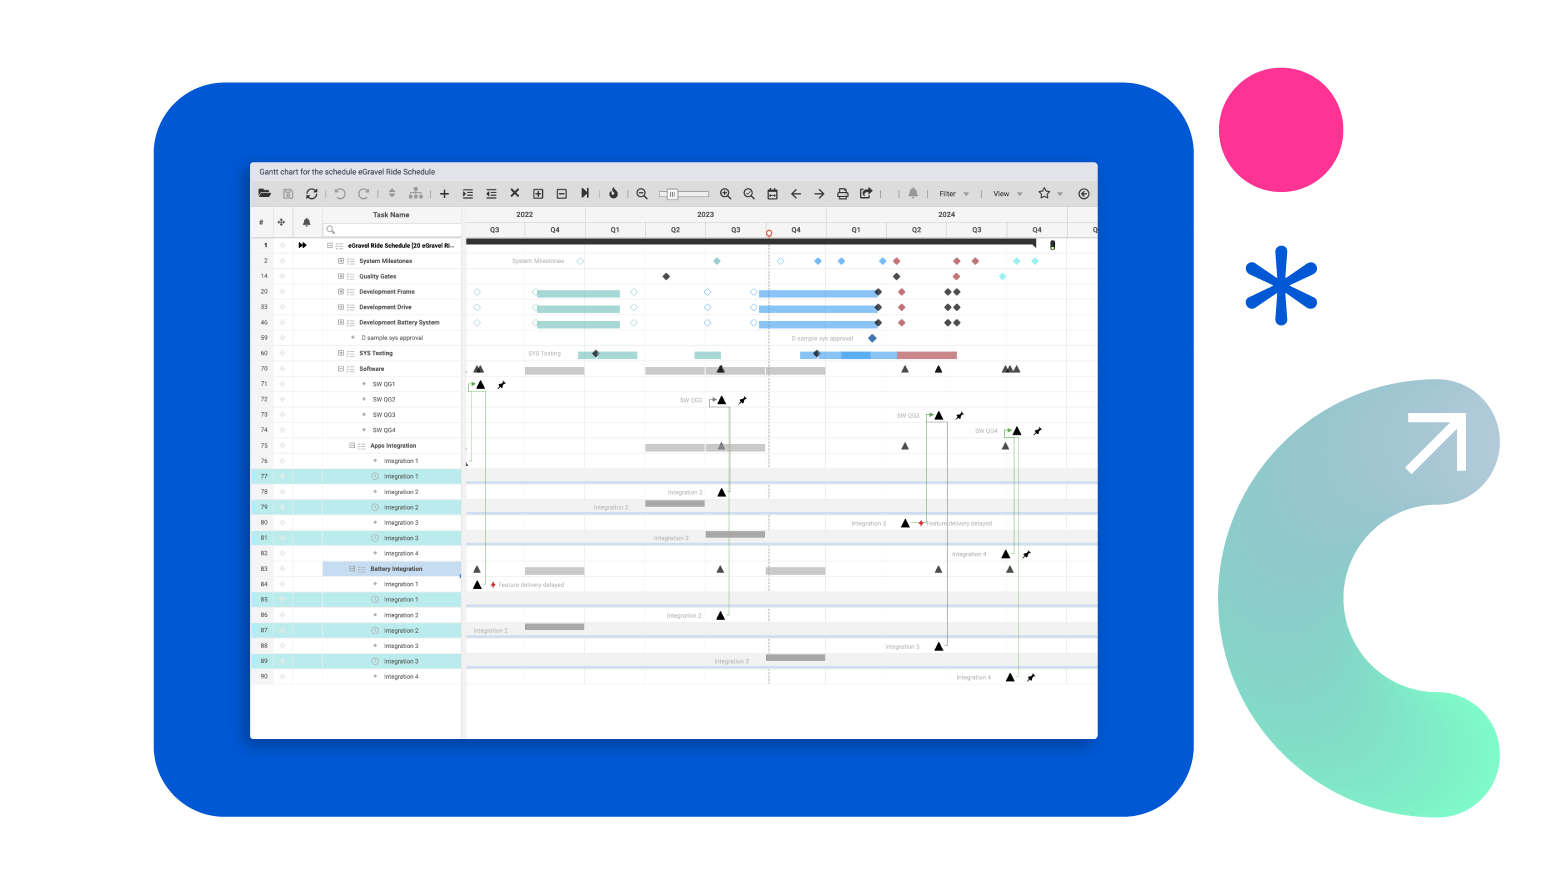
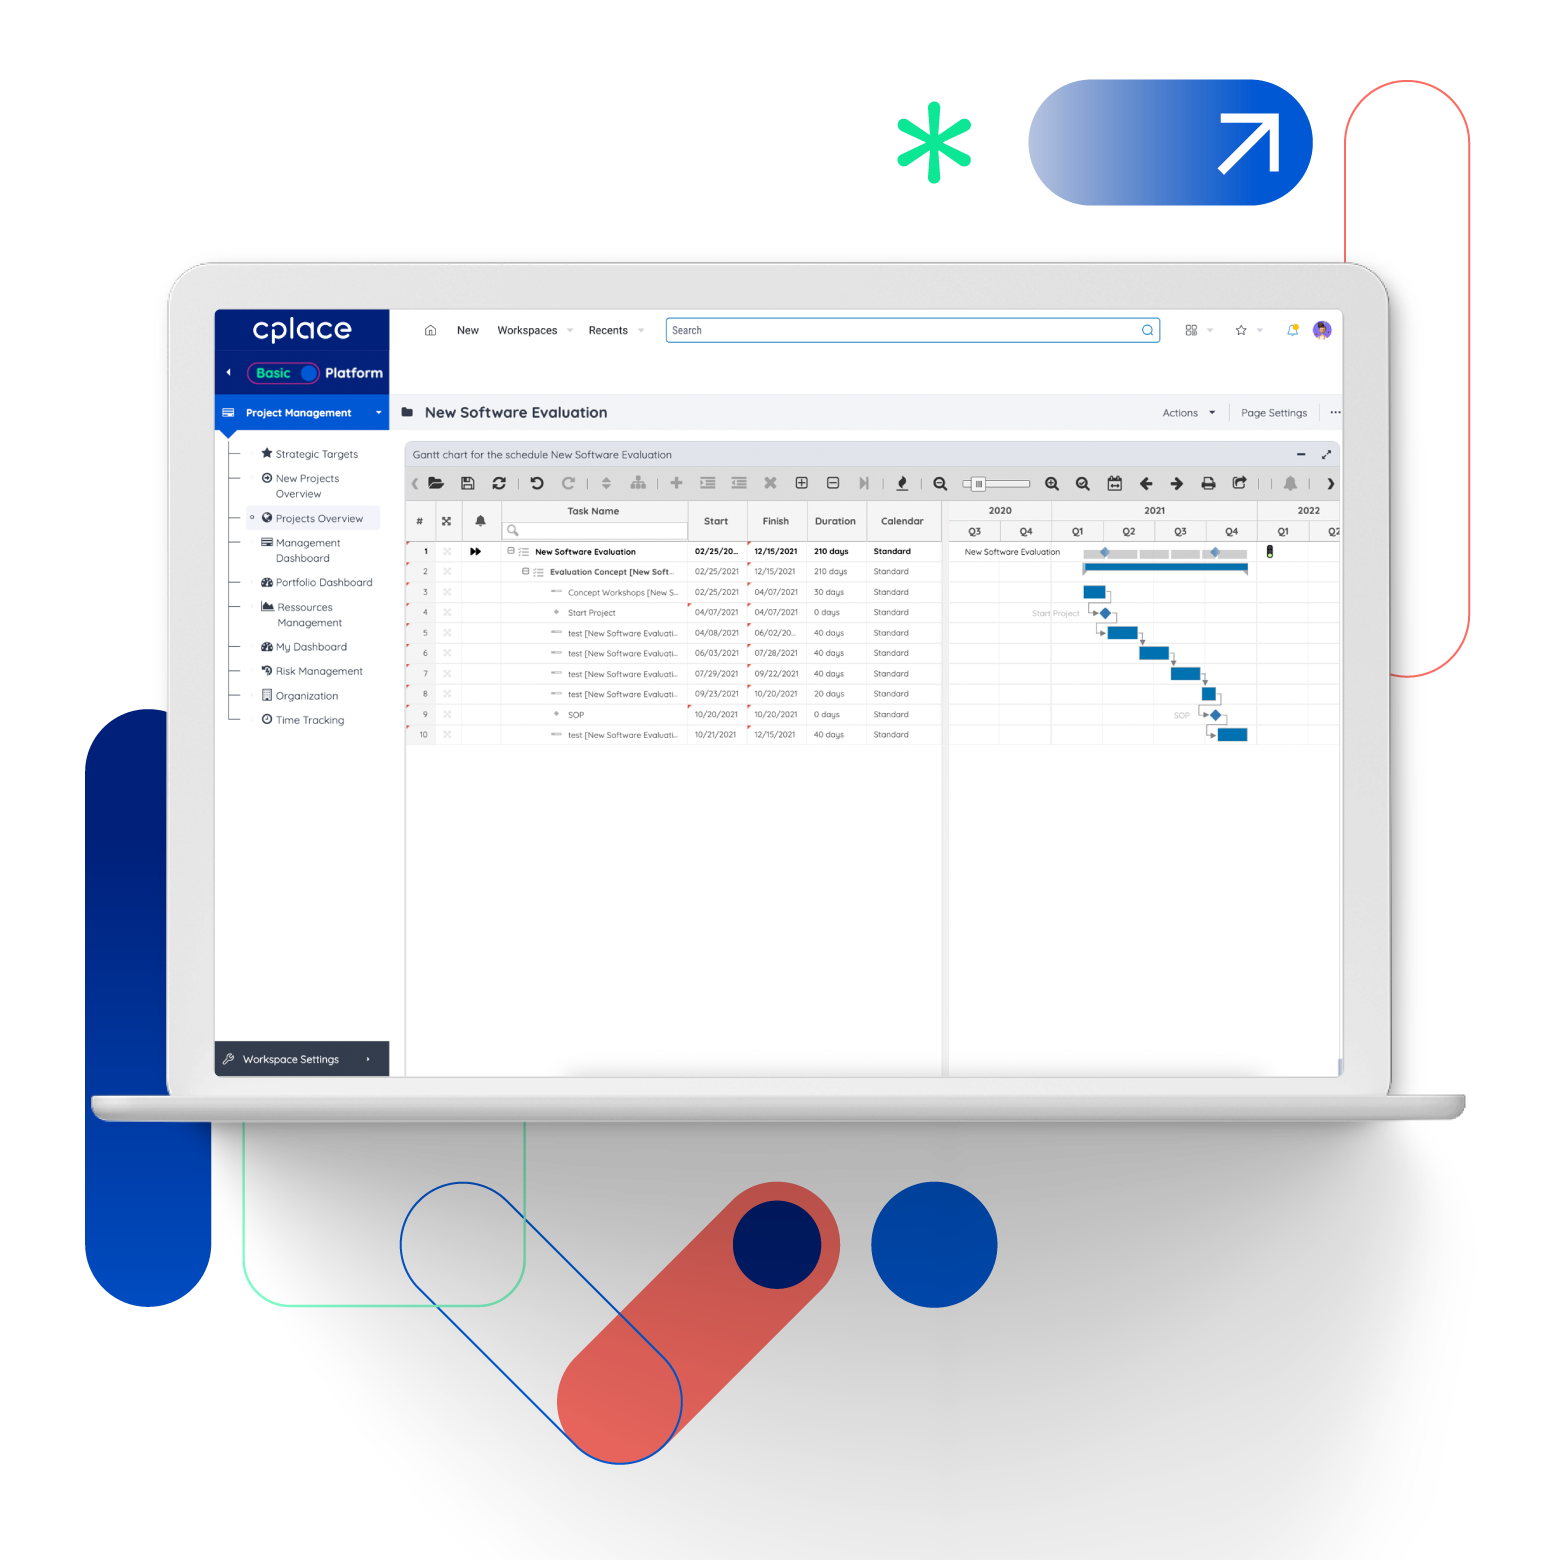
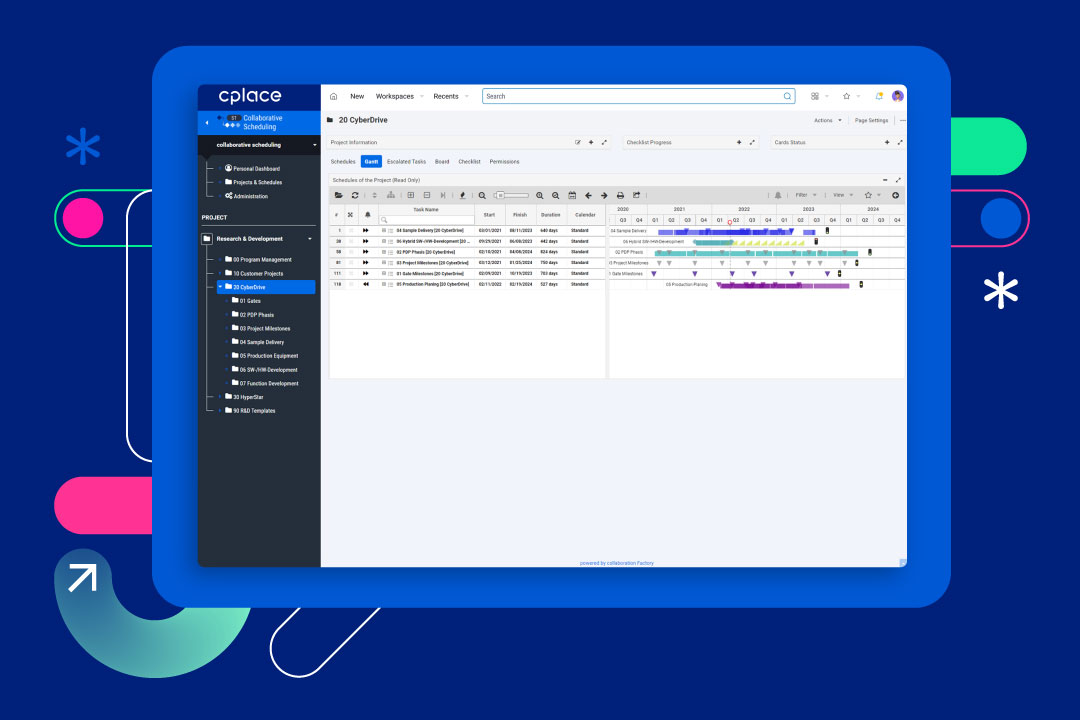
Gantt charts are one of the most widespread and effective methods of visualizing the timing of tasks or activities using a horizontal bar chart. On the left-hand side of the chart is a list of activities, while a corresponding timeline runs from left to right at the top.
Each bar in the Gantt chart represents a specific task or activity. The position of the bar on the timeline indicates the start and end time, and the length of the bar indicates the duration of each task.
The essential components of a Gantt chart
Gantt charts enable teams to record dependencies, plan workflows and manage projects accurately. The elements that make up a Gantt chart in project planning include:
- Tasks/activities: The structured presentation in the Gantt chart ensures that all activities are included in the project planning. This ensures that no subtask of a project is overlooked.
- Dates: The start and end dates illustrate when the entire project begins and ends.

- Estimated duration: This information can be used to ensure that each task is completed on time. It also enables the entire project to be monitored over time.
- Dependencies: The display of relationships between activities makes it clear that certain tasks can only be completed when others have already been completed. This makes it easier to monitor progress.
- Milestones: They provide an efficient overview of all relevant project data and represent milestones and key moments in the project.

How is a Gantt chart created?
The prerequisite for creating a Gantt chart is a work breakdown structure that has already been drawn up. All tasks and sub-tasks must be known and named and placed in a logical and chronological order.
Creating a Gantt chart usually requires the use of software or special tools developed for project management, as this makes the processes much easier.
To create a Gantt chart, the following steps should be followed:
1. Identification of the tasks:
Initially, all tasks and activities of the project must be defined and put in order.
2. Definition of a time frame:
A Gantt chart requires clear start and end dates for the projects, which are visualized along a timeline and therefore need a clear start and end marker.
3. Definition of dependencies:
In extensive projects, some tasks may not start until others have been completed. To ensure that the team works together smoothly and that the project runs efficiently, dependencies between tasks should also be shown graphically in the Gantt chart.
4. Determination of milestones:
Milestones are milestones in the Gantt chart that can be highlighted.
5. Estimation and allocation of resources:
The required resources must be identified and estimated. If necessary, the resources can be assigned to the tasks in order to visualize the workload.
6. Monitoring and adjustment:
The progress of the project must be regularly monitored using the Gantt chart and adjusted if necessary.
Which projects are Gantt charts suitable for?
Gantt charts are suitable for a variety of projects in different industries and areas. However, they are particularly suitable for large projects that involve complex tasks, many dependencies and various milestones. A Gantt chart is particularly helpful for projects with start and end dates, as the timelines can be visualized as bars. Teams are supported by the clear presentation of the Gantt chart so that projects can be completed efficiently and on time.
Download the MTU case study
The advantages of a Gantt chart in project planning
Visualization
Gantt charts provide a clear representation of the chronological sequence and order of the work to be carried out. They create transparency about the project plan and the timeline by making it clear which tasks are to be carried out when, including the dependencies between the various tasks.
Time management
By clearly showing the planned activities, the Gantt chart helps to monitor the progress of the project and ensures that everything goes according to plan.
Project structuring
A Gantt chart acts as an orientation aid in project management and facilitates the coordination of extensive projects. Similar to a map, it enables teams to plan each step in advance and determine the next direction.
Communication
As everyone involved can quickly and easily track the progress of the project, communication within the project team and with stakeholders is greatly facilitated.
Resource management
In Gantt charts, responsibilities are made visible through resource allocations.
Identification of bottlenecks
Bottlenecks and conflicts in the allocation of resources or in the schedule can be identified in good time and appropriate measures can be taken.
The disadvantages of a Gantt chart in project planning
Growing complexity
Gantt charts provide a comprehensive overview. However, this can be a challenge for large projects with numerous tasks and resources. For example, teams may perceive the Gantt chart as being too detailed and may lose track of things as a result. To counteract this challenge, it is important to structure the tasks and subtasks in project management properly.
Increasing workload
The initial flexibility can become a challenge, as the time planning in the Gantt chart also has to be adjusted when changes are made to the project. Project management software that adapts flexibly to the needs of the organization and individual teams makes it easier to create and maintain Gantt charts.
Required linearity
A rough idea of the end goal and the required steps must already exist at the start of the project. In projects without a concretely defined end result, a Gantt chart may prove less useful.
Modern schedule management at MTU
In our free white paper, you can find out how MTU Aero Engines coordinates its complex projects between different teams at all locations and how process changes and improvements in the lean area are mapped using agile application development.