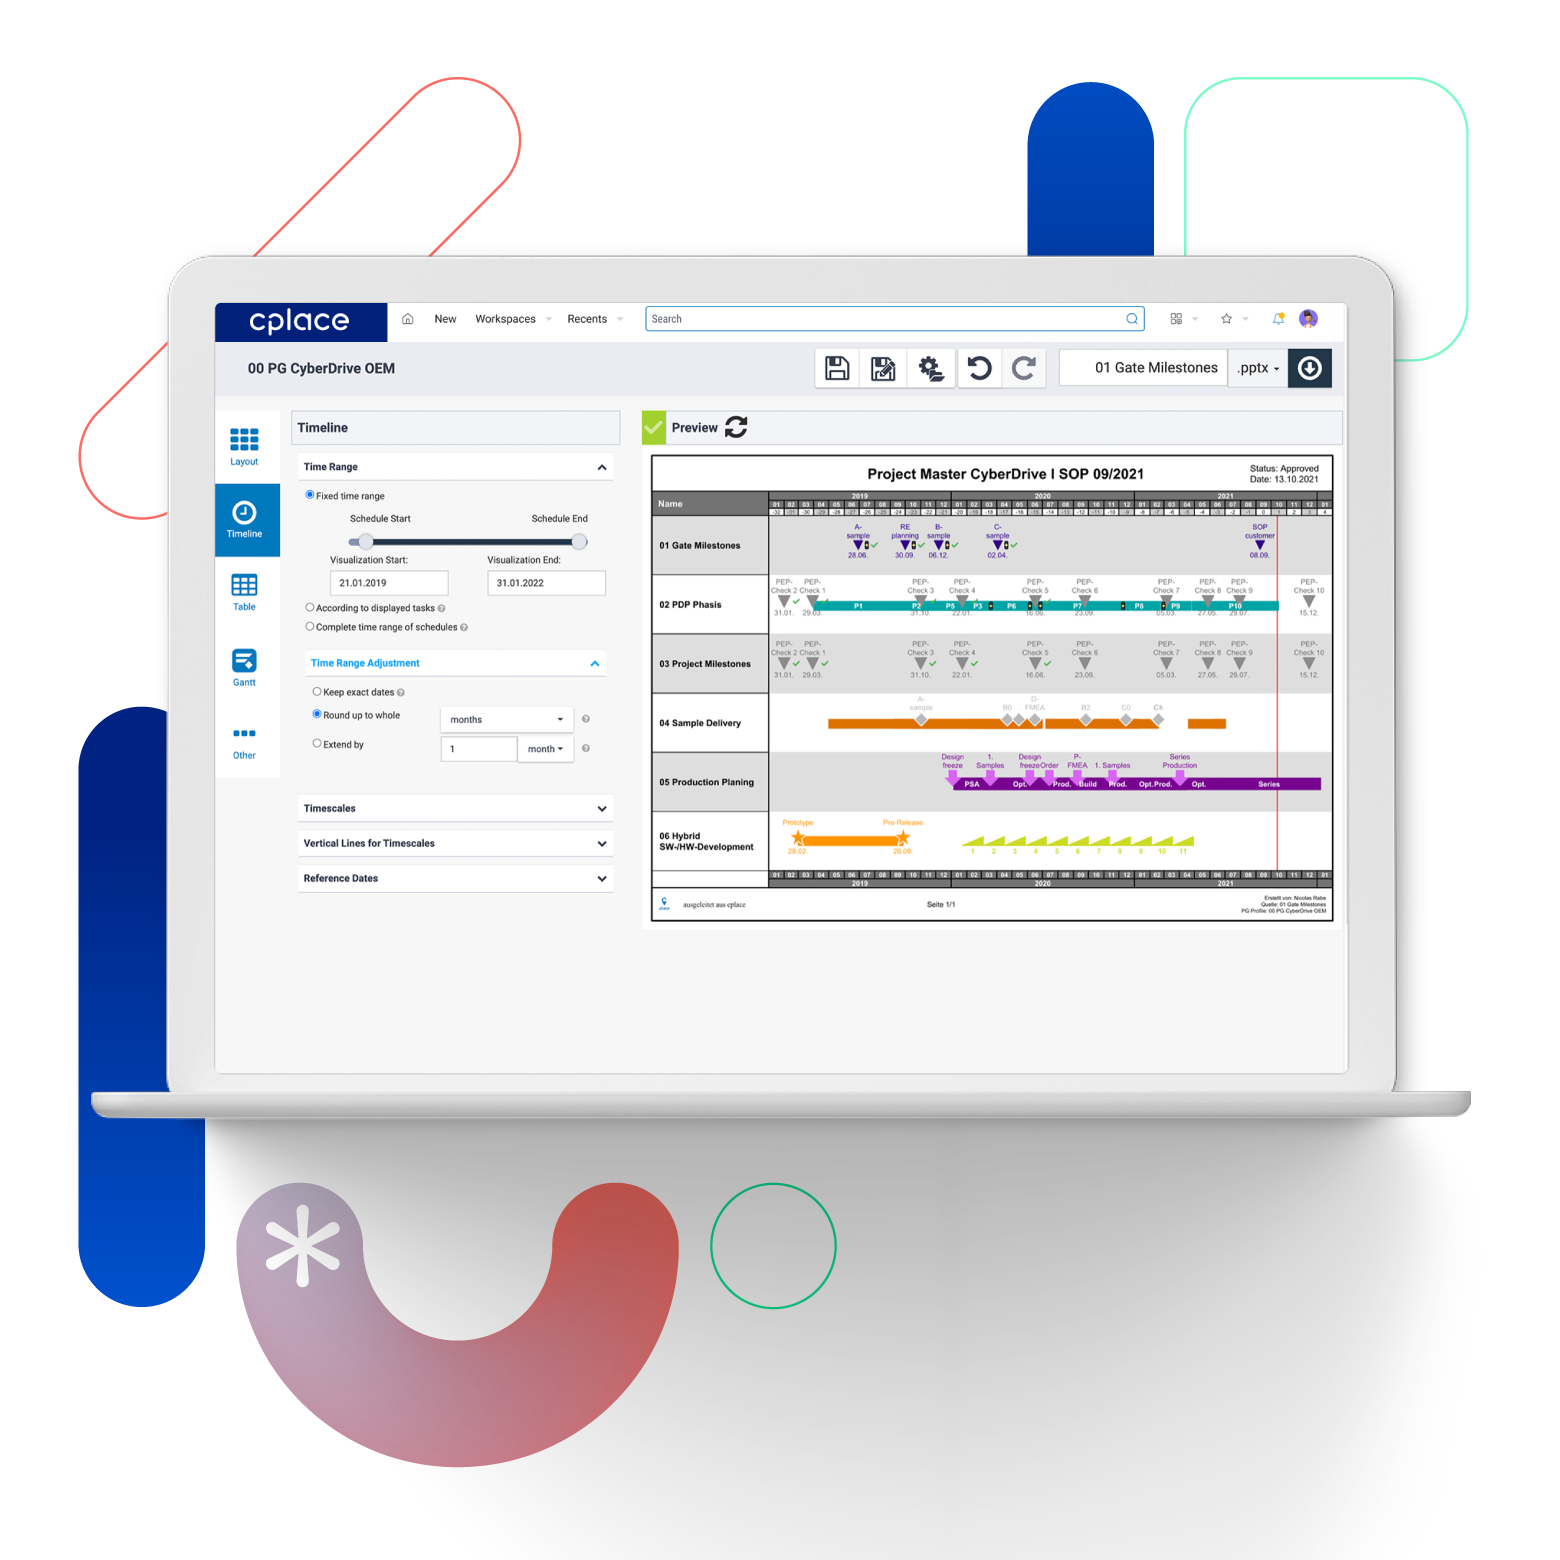
Convince the stakeholders of your projects with professional project reports, created with just a few clicks. Generate individual reports with real-time data – easily and quickly as PowerPoint, PDF or graphic files. Extensive, intuitive visualization tools enable quick customization. Individual design templates can be saved and reused; this saves additional time during project reporting. The PG-Export app (Presentation Graphic App) is part of cplace Enterprise Scheduling.
Highlights
Preparation for Management
Export of current planning data to various formats and templates with a single click
Web Configurator
Precise selection of planning information and customized design for different reports
Standardization
Customization of visualization settings and reuse as templates
Benefits
The cplace App PG-Export is an efficient tool for exporting real-time planning data for reports in a time-saving and simple way. Even complex schedules can be prepared professionally for customers, committees and all stakeholders who do not work with cplace.
Reusable templates can be used to standardize recurring report formats.
This might also be interesting to you
Enterprise Scheduling
Manage even complex projects with collaborative project management.
Gantt Timebox
The Gantt Timebox connects the project world with the process and product world.
Enterprise Board
Integrate agile task management into hybrid planning worlds.
